Squeeze Momentum Indicator: How to Use It?
The Squeeze Momentum Indicator is a robust technical analysis tool that blends the principles of both Bollinger Bands and Keltner Channels. Developed by John Carter, the Squeeze Momentum Indicator combines elements of volatility analysis and momentum oscillators to help traders anticipate significant market moves.
Technical analysis tools
Technical analysis tools encompass a diverse range of indicators and techniques used by traders to analyze historical price data and forecast future price movements in financial markets. Some widely used technical analysis tools include:
Moving Averages: These smooth out price data to identify trends and provide support and resistance levels.
Relative Strength Index (RSI): A momentum oscillator that measures the speed and change of price movements, indicating overbought and oversold conditions.
MACD (Moving Average Convergence Divergence): A trend-following momentum indicator that identifies changes in the strength, direction, momentum, and duration of a trend.
Bollinger Bands: These consist of a middle band representing a moving average and upper and lower bands representing volatility levels, useful for identifying potential price breakouts.
Fibonacci Retracement: A tool used to identify potential support and resistance levels based on Fibonacci ratios derived from the Fibonacci sequence.
Volume Analysis: Analyzing trading volume to confirm price trends and identify potential reversals.
Candlestick Patterns: These visually represent price movements and patterns to identify potential trend reversals or continuations.
Support and Resistance Levels: Price levels where buying or selling pressure historically causes prices to bounce or reverse.
Bollinger Bands and Keltner Channels
As stated earlier, the Squeeze Momentum Indicator is a powerful technical analysis tool combining Bollinger Bands and Keltner Channels.
Bollinger Bands and Keltner Channels are two popular technical analysis tools used by traders to assess price volatility and potential trading opportunities.
Bollinger Bands consist of three lines plotted on a price chart: a middle line representing a moving average (typically a simple moving average) and two outer bands that are standard deviations away from the middle line.
The width of the bands expands and contracts based on price volatility. The bands widen in times of high volatility, while they narrow during low volatility periods.
Traders often use Bollinger Bands to identify potential reversal points or breakouts. For instance, when prices touch or move beyond the outer bands, it may signal overbought or oversold conditions, suggesting a potential reversal. Conversely, a breakout above or below the bands may indicate a continuation of the current trend.
Keltner Channels:
Keltner Channels, named after their creator, Chester Keltner, are similar to Bollinger Bands but use a different calculation method.
channels of Keltner consist of three lines: a middle line, typically a simple moving average, and
upper and lower channels plotted at a certain distance from the middle line. This distance is typically based on the asset’s Average True Range (ATR).
Unlike Bollinger Bands, which use standard deviations, Keltner Channels incorporate volatility through the ATR, which adjusts dynamically based on recent price movements.
Traders use Keltner Channels to identify potential trend reversals or breakout opportunities. Similar to Bollinger Bands, prices touching or exceeding the channel boundaries may indicate overbought or oversold conditions or signal potential breakout points.
Hot to utilize Squeeze Momentum Indicator?
Utilizing the Squeeze Momentum Indicator can offer traders significant advantages by shedding light on market trends and potential shifts in momentum. One of its primary applications is anticipating market movements when Bollinger Bands and Keltner Channels contract, enabling traders to seize opportunities presented by these fluctuations.
Furthermore, it serves as a tool to validate signals generated by other technical analysis tools.
The indicator yields both positive and negative values. Positive values denote upward price movement and increasing momentum, while negative values indicate downward price movement and decreasing momentum.
Each bar in the Squeeze Momentum histogram represents the degree of tightness between the contracting bands. A higher Squeeze Momentum Indicator value indicates tighter bands, suggesting an impending sharp price movement.
During periods of heightened market volatility, combining the Squeeze Momentum Indicator with other technical tools like the Relative Strength Index (RSI) and Moving Average Convergence Divergence (MACD) is advisable for optimal performance. Nevertheless, it’s vital to acknowledge that no single technical indicator is infallible.
Thorough research is imperative before executing trades based solely on these indicators. By integrating a mix of indicators, traders can make more informed decisions and potentially refine their trading strategies.
Relative Strength Index (RSI) and Moving Average Convergence Divergence (MACD)
The Relative Strength Index (RSI) and Moving Average Convergence Divergence (MACD) are two widely used technical analysis indicators that provide insights into market momentum and potential trend reversals.
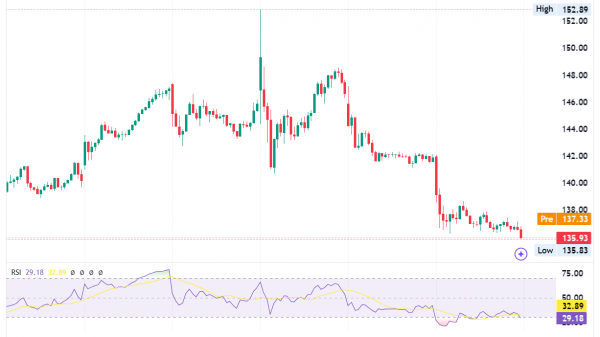
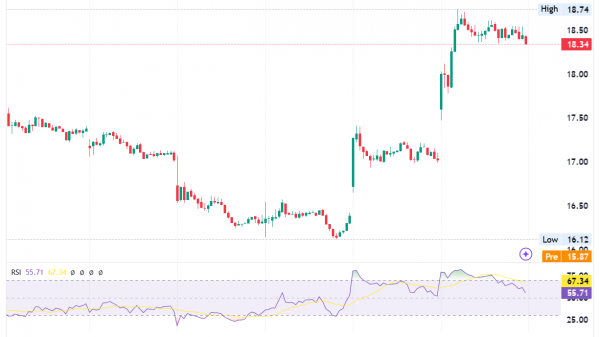
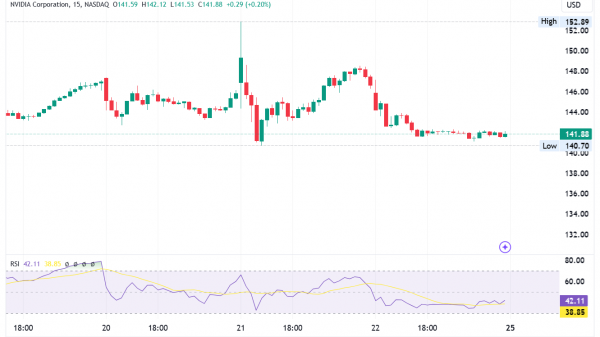
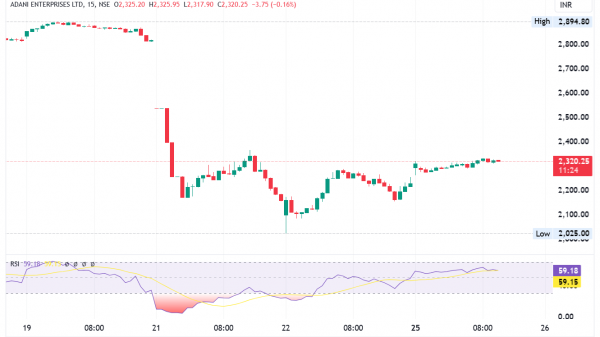
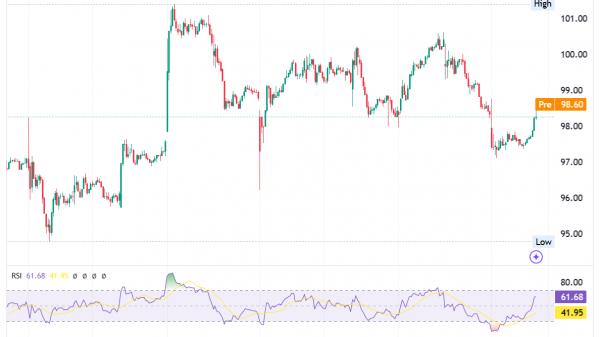
RSI is a momentum oscillator that measures the speed and change of price movements. It oscillates between 0 and 100 and is typically plotted below the price chart. RSI compares the magnitude of recent gains and losses over a specified period (usually 14 days) to determine whether a stock is overbought or oversold.
When RSI values exceed 70, it indicates overbought conditions, suggesting a potential price reversal or pullback. Conversely, RSI values below 30 signal oversold conditions, implying a potential bounce or uptrend reversal. Traders often use RSI to confirm trends, identify potential entry or exit points, and anticipate trend reversals.
Moving Average Convergence Divergence (MACD):
MACD is a trend-following momentum indicator that consists of two lines: the MACD line and the signal line. It is plotted on a separate chart below the price chart. The MACD line is calculated by subtracting the 26-period exponential moving average (EMA) from the 12-period EMA. The signal line, often a 9-period EMA of the MACD line, triggers buy or sell signals.
When the MACD line crosses above the signal line, it generates a bullish signal, indicating increasing upward momentum. Conversely, when the MACD line crosses below the signal line, it generates a bearish signal, signaling potential downward momentum. Traders use MACD to identify trends, confirm trend reversals, and generate buy or sell signals.
To sum up, the Squeeze Momentum Indicator may not yield accurate results during periods of elevated volatility. Hence, it’s prudent for traders to complement it with other indicators like RSI or MACD. Besides, traders should always exercise caution, conduct independent research, and perform comprehensive analysis before entering into any trades.
The post Squeeze Momentum Indicator: How to Use It? appeared first on FinanceBrokerage.


